tantalum Thermodynamic Properties vs Temperature (CAS 7440-25-7)
Analyze how thermophysical properties change over a temperature range at a constant pressure of 1 atm.
Related Calculators for tantalum
Input Conditions
Define the chemical and range for the property profile.
Property Profile for tantalum
Calculated properties vs. Temperature
Profile Data
| Temperature (°C) | Specific heat capacity (kJ/kg·K) | Density (kg/m³) | Dynamic viscosity (cP) | Thermal conductivity (W/m·K) | Prandtl number () | Molar volume (m³/kmol) | Specific enthalpy (kJ) | Specific entropy (kJ/kg·K) | Phase |
|---|---|---|---|---|---|---|---|---|---|
| -23.15 | 0.138542 | 1.6400e+4 | N/A | 57.4 | N/A | 0.0110334 | -6.70148 | -0.0245111 | s |
| -18.048 | 0.138677 | 1.6400e+4 | N/A | 57.3955 | N/A | 0.0110334 | -5.99428 | -0.0217109 | s |
| -12.9459 | 0.138812 | 1.6400e+4 | N/A | 57.3906 | N/A | 0.0110334 | -5.2864 | -0.0189634 | s |
| -7.84388 | 0.138947 | 1.6400e+4 | N/A | 57.3887 | N/A | 0.0110334 | -4.57783 | -0.0162666 | s |
| -2.74184 | 0.139082 | 1.6400e+4 | N/A | 57.3933 | N/A | 0.0110334 | -3.86858 | -0.0136186 | s |
| 2.3602 | 0.139217 | 1.6400e+4 | N/A | 57.4081 | N/A | 0.0110334 | -3.15863 | -0.0110176 | s |
| 7.46224 | 0.139352 | 1.6400e+4 | N/A | 57.4319 | N/A | 0.0110334 | -2.44799 | -0.00846186 | s |
| 12.5643 | 0.139487 | 1.6400e+4 | N/A | 57.4589 | N/A | 0.0110334 | -1.73667 | -0.00594973 | s |
| 17.6663 | 0.139622 | 1.6400e+4 | N/A | 57.483 | N/A | 0.0110334 | -1.02466 | -0.00347967 | s |
| 22.7684 | 0.139757 | 1.6400e+4 | N/A | 57.4979 | N/A | 0.0110334 | -0.311953 | -0.00105023 | s |
| 27.8704 | 0.139893 | 1.6400e+4 | N/A | 57.5007 | N/A | 0.0110334 | 0.40144 | 0.00133999 | s |
| 32.9724 | 0.140032 | 1.6400e+4 | N/A | 57.5145 | N/A | 0.0110334 | 1.11553 | 0.00369235 | s |
| 38.0745 | 0.140173 | 1.6400e+4 | N/A | 57.5399 | N/A | 0.0110334 | 1.83034 | 0.00600814 | s |
| 43.1765 | 0.140318 | 1.6400e+4 | N/A | 57.5689 | N/A | 0.0110334 | 2.54588 | 0.0082886 | s |
| 48.2786 | 0.140465 | 1.6400e+4 | N/A | 57.5938 | N/A | 0.0110334 | 3.26216 | 0.0105349 | s |
| 53.3806 | 0.140613 | 1.6400e+4 | N/A | 57.6072 | N/A | 0.0110334 | 3.97919 | 0.0127482 | s |
| 58.4827 | 0.140764 | 1.6400e+4 | N/A | 57.6093 | N/A | 0.0110334 | 4.69699 | 0.0149294 | s |
| 63.5847 | 0.140916 | 1.6400e+4 | N/A | 57.6049 | N/A | 0.0110334 | 5.41556 | 0.0170797 | s |
| 68.6867 | 0.141069 | 1.6400e+4 | N/A | 57.5993 | N/A | 0.0110334 | 6.13491 | 0.0191999 | s |
| 73.7888 | 0.141224 | 1.6400e+4 | N/A | 57.5973 | N/A | 0.0110334 | 6.85505 | 0.021291 | s |
| 78.8908 | 0.141379 | 1.6400e+4 | N/A | 57.604 | N/A | 0.0110334 | 7.57597 | 0.0233538 | s |
| 83.9929 | 0.141535 | 1.6400e+4 | N/A | 57.6207 | N/A | 0.0110334 | 8.29769 | 0.0253892 | s |
| 89.0949 | 0.141691 | 1.6400e+4 | N/A | 57.6442 | N/A | 0.0110334 | 9.02021 | 0.0273979 | s |
| 94.1969 | 0.141848 | 1.6400e+4 | N/A | 57.6706 | N/A | 0.0110334 | 9.74352 | 0.0293807 | s |
| 99.299 | 0.142004 | 1.6400e+4 | N/A | 57.6965 | N/A | 0.0110334 | 10.4676 | 0.0313384 | s |
| 104.401 | 0.142161 | 1.6400e+4 | N/A | 57.7186 | N/A | 0.0110334 | 11.1925 | 0.0332715 | s |
| 109.503 | 0.142318 | 1.6400e+4 | N/A | 57.7374 | N/A | 0.0110334 | 11.9183 | 0.0351808 | s |
| 114.605 | 0.142475 | 1.6400e+4 | N/A | 57.7546 | N/A | 0.0110334 | 12.6448 | 0.0370669 | s |
| 119.707 | 0.142631 | 1.6400e+4 | N/A | 57.772 | N/A | 0.0110334 | 13.3721 | 0.0389303 | s |
| 124.809 | 0.142787 | 1.6400e+4 | N/A | 57.7913 | N/A | 0.0110334 | 14.1002 | 0.0407717 | s |
| 129.911 | 0.142942 | 1.6400e+4 | N/A | 57.8143 | N/A | 0.0110334 | 14.8291 | 0.0425917 | s |
| 135.013 | 0.143097 | 1.6400e+4 | N/A | 57.8411 | N/A | 0.0110334 | 15.5588 | 0.0443907 | s |
| 140.115 | 0.143252 | 1.6400e+4 | N/A | 57.871 | N/A | 0.0110334 | 16.2893 | 0.0461693 | s |
| 145.217 | 0.143405 | 1.6400e+4 | N/A | 57.9034 | N/A | 0.0110334 | 17.0205 | 0.0479279 | s |
| 150.319 | 0.143558 | 1.6400e+4 | N/A | 57.9374 | N/A | 0.0110334 | 17.7526 | 0.0496671 | s |
| 155.421 | 0.14371 | 1.6400e+4 | N/A | 57.9724 | N/A | 0.0110334 | 18.4854 | 0.0513873 | s |
| 160.523 | 0.143861 | 1.6400e+4 | N/A | 58.0074 | N/A | 0.0110334 | 19.219 | 0.053089 | s |
| 165.626 | 0.144012 | 1.6400e+4 | N/A | 58.0418 | N/A | 0.0110334 | 19.9534 | 0.0547724 | s |
| 170.728 | 0.144161 | 1.6400e+4 | N/A | 58.0749 | N/A | 0.0110334 | 20.6885 | 0.0564382 | s |
| 175.83 | 0.144309 | 1.6400e+4 | N/A | 58.1058 | N/A | 0.0110334 | 21.4244 | 0.0580866 | s |
| 180.932 | 0.144456 | 1.6400e+4 | N/A | 58.1338 | N/A | 0.0110334 | 22.161 | 0.0597181 | s |
| 186.034 | 0.144603 | 1.6400e+4 | N/A | 58.1581 | N/A | 0.0110334 | 22.8984 | 0.0613329 | s |
| 191.136 | 0.144748 | 1.6400e+4 | N/A | 58.178 | N/A | 0.0110334 | 23.6366 | 0.0629316 | s |
| 196.238 | 0.144892 | 1.6400e+4 | N/A | 58.1928 | N/A | 0.0110334 | 24.3755 | 0.0645143 | s |
| 201.34 | 0.145035 | 1.6400e+4 | N/A | 58.2016 | N/A | 0.0110334 | 25.1151 | 0.0660815 | s |
| 206.442 | 0.145176 | 1.6400e+4 | N/A | 58.2047 | N/A | 0.0110334 | 25.8554 | 0.0676335 | s |
| 211.544 | 0.145317 | 1.6400e+4 | N/A | 58.204 | N/A | 0.0110334 | 26.5965 | 0.0691705 | s |
| 216.646 | 0.145456 | 1.6400e+4 | N/A | 58.2015 | N/A | 0.0110334 | 27.3382 | 0.0706929 | s |
| 221.748 | 0.145594 | 1.6400e+4 | N/A | 58.1995 | N/A | 0.0110334 | 28.0807 | 0.0722009 | s |
| 226.85 | 0.145731 | 1.6400e+4 | N/A | 58.2 | N/A | 0.0110334 | 28.8239 | 0.0736949 | s |
Property Profiles for tantalum
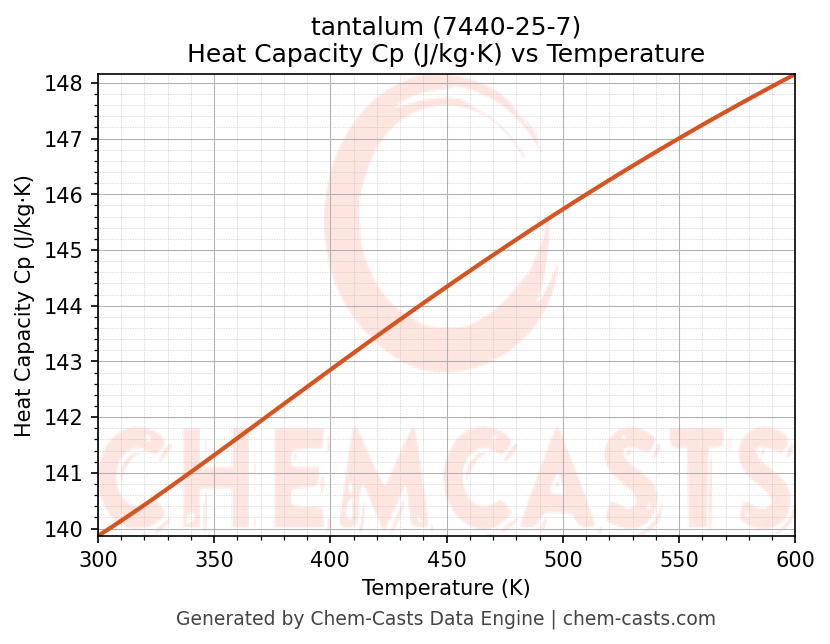
Heat Capacity (Cp) vs Temperature
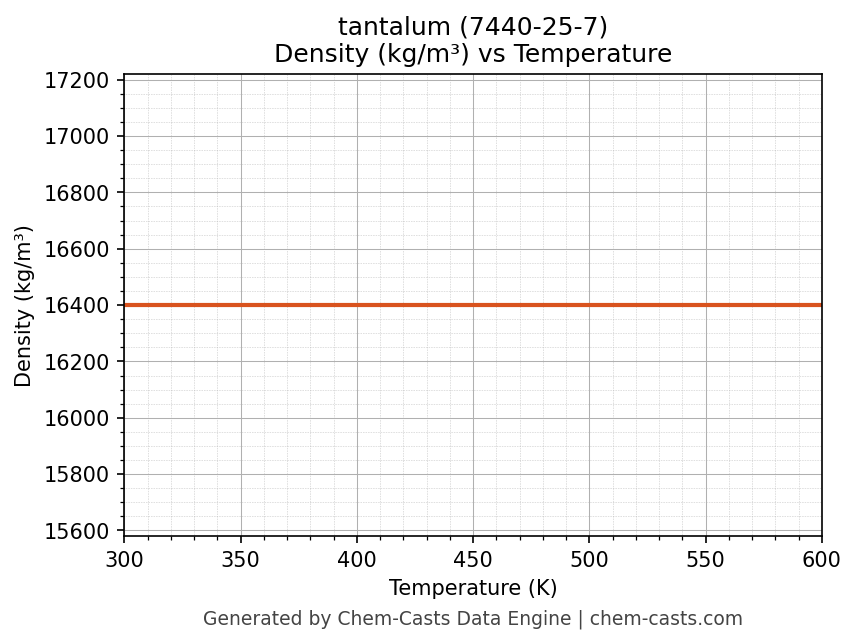
Density vs Temperature
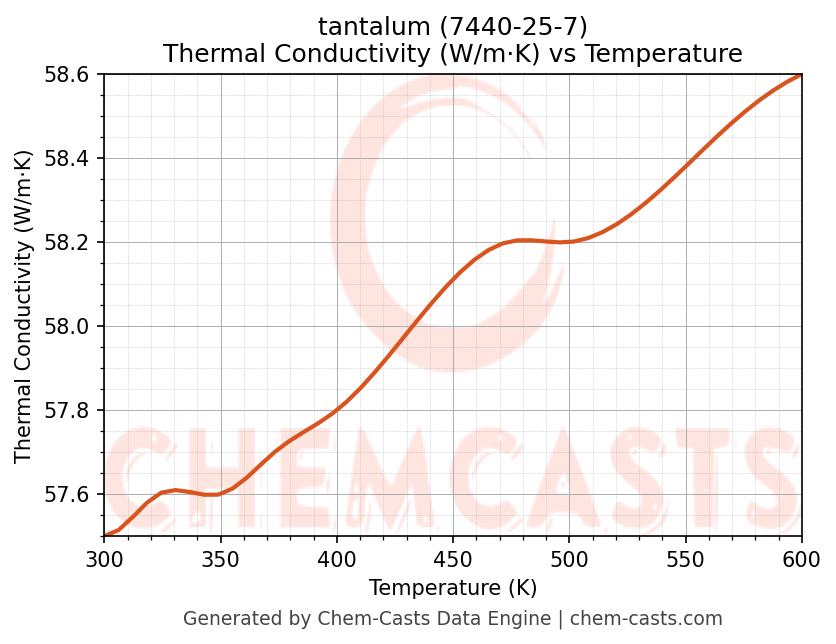
Thermal Conductivity vs Temperature
Thermodynamic Property Profile at Constant Pressure
This page presents the temperature-dependent thermodynamic and transport properties of tantalum (CAS 7440-25-7) calculated at a constant pressure of 1 atm (101325 Pa) over the temperature range 250-500 K.
The properties shown - specific heat capacity (Cp), density (ρ), dynamic viscosity (μ), thermal conductivity (k), Prandtl number (Pr), molar volume (Vm), specific enthalpy (H), and specific entropy (S) - are among the most commonly used parameters in chemical engineering calculations, process simulation, and thermal system design.
All values are generated programmatically using validated thermodynamic correlations and equations of state and represent equilibrium properties at the specified pressure.
Understanding the Property Trends
- Specific heat capacity (Cp) indicates the amount of energy required to raise the temperature of tantalum and is critical for energy balance and heat-exchanger design.
- Density (ρ) and molar volume (Vm) describe volumetric behavior and are required for flow calculations, equipment sizing, and storage design.
- Dynamic viscosity (μ) governs fluid flow resistance, influencing Reynolds number and pressure drop.
- Thermal conductivity (k) and Prandtl number (Pr) are essential inputs for convective heat-transfer correlations.
- Specific enthalpy (H) and specific entropy (S) are fundamental thermodynamic properties used in process modeling, compression, and expansion analysis.
Property trends with temperature may vary depending on molecular structure, intermolecular interactions, and phase stability.
Engineering Applications
The temperature-dependent properties of tantalum at atmospheric pressure are commonly required in:
- Heat exchanger and reactor design
- Process simulation and thermodynamic modeling
- Fluid flow and pressure-drop calculations
- Energy balance and equipment sizing
- Chemical engineering education and research
These profiles are particularly useful when evaluating system performance over a wide operating temperature range under near-ambient pressure conditions.
Frequently Asked Questions
At what pressure are these properties calculated?
All properties on this page are calculated at a constant pressure of 1 atm (101325 Pa).
Can these values be used in process simulation software?
Yes. The data is suitable for preliminary design, validation, and educational use. For licensed simulators, vendor-specific property packages should be referenced.
Can I change the pressure or temperature range?
Yes. Use the interactive controls above to generate custom property profiles at different pressures or temperature ranges.