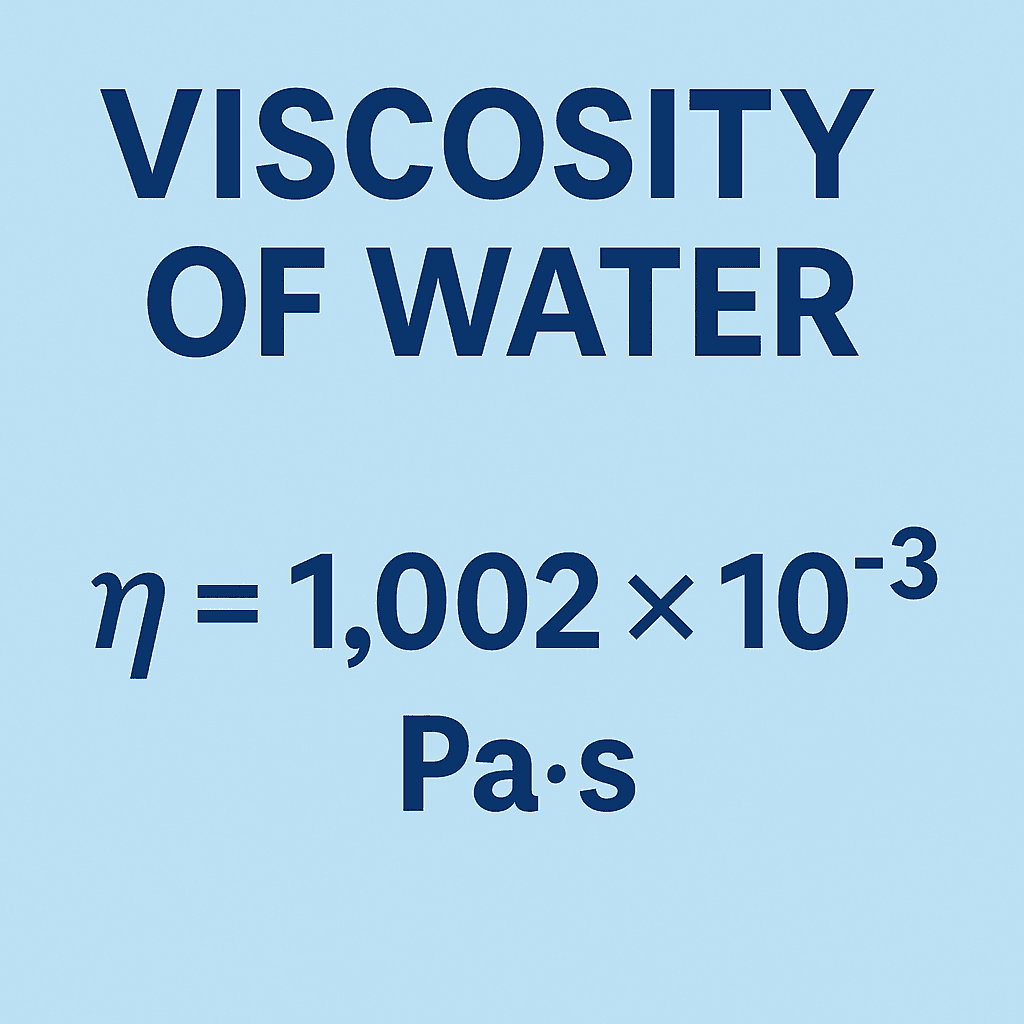
Water Dynamic Viscosity Table (0–100°C, 1 bar)
ull reference table of water viscosity (dynamic & kinematic) vs temperature. Export to Excel, CSV, PDF. Interactive Chart.js plot included. Source: IAPWS-95.
Dynamic Viscosity of Water vs Temperature
Property Data
| Temperature (°C) | Dynamic Viscosity (mPa·s) | Kinematic Viscosity (mm²/s) |
|---|---|---|
| 0 | 1.792 | 1.792 |
| 5 | 1.519 | 1.518 |
| 10 | 1.307 | 1.306 |
| 15 | 1.139 | 1.139 |
| 20 | 1.002 | 1.004 |
| 25 | 0.89 | 0.893 |
| 30 | 0.797 | 0.8 |
| 35 | 0.719 | 0.723 |
| 40 | 0.653 | 0.656 |
| 45 | 0.596 | 0.6 |
| 50 | 0.546 | 0.55 |
| 60 | 0.466 | 0.47 |
| 70 | 0.404 | 0.409 |
| 80 | 0.353 | 0.359 |
| 90 | 0.312 | 0.32 |
| 100 | 0.282 | 0.291 |
Key Insights
- •Viscosity of water decreases exponentially with temperature.
- •At 100°C, water’s viscosity is nearly one-sixth of its value at 0°C.
- •Values are based on IAPWS-95 reference data rounded for engineering use.
Associated Images

Downloadable Files
water_viscosity_1bar.csv
DownloadRelated Knowledge
Explore these guides related to Water Dynamic Viscosity Table (0–100°C, 1 bar).
