Cooling Tower Efficiency: Formula, Psychrometric Principles, and Real-World Optimization

Cooling Tower Efficiency: Formula, Psychrometric Principles, and Real-World Optimization
🏭 Introduction
Cooling towers are the unsung workhorses of industrial plants, daily rejecting gigawatts of waste heat generated by chemical reactors, gas turbines, and HVAC systems, using nothing but air and water.
Yet, 90% of operators cannot answer:
"What is my cooling tower's true efficiency - and how do I improve it?"
This guide is your complete playbook for:
- Real efficiency calculation (NOT just textbook numbers)
- Psychrometrics to predict performance
- Diagnosing hidden losses with field data
- Implementing low-cost upgrades that save 200K/year
- Leveraging digital tools and automation
1️⃣ Real Formula for Efficiency of Cooling Towers
Forget the oversimplified version - true efficiency accounts for evaporation, drift, and air saturation.
Standard Efficiency (η_std)
But this ignores evaporation rate.
True Thermal Efficiency (η_true)
Explanation
| Term | Meaning |
|---|---|
| Evaporation rate (kg/h) | |
| Latent heat of vaporization (~2450 kJ/kg) | |
| Enthalpy of saturated air at wet-bulb temperature |
Reality Check: Most towers run at 55-75% η_std, but only 40-60% η_true due to poor air utilization.
2️⃣ Field Example: 5000 m³/h Cross-Flow Tower
| Parameter | Value |
|---|---|
| Water flow | 5000 m³/h |
| 43.2 °C | |
| 32.8 °C | |
| Ambient DB | 35 °C |
| Air flow | 1,800,000 m³/h |
Step 1: Standard Efficiency
Step 2: Heat Rejection
Step 3: Rate of Evaporation
Step 4: True Efficiency
Using psychrometric chart:
- (oversaturated)
Insight: Tower is only 58% thermally efficient despite 70% η_std.
3️⃣ Psychrometrics: The Hidden Driver
Wet-Bulb Depression
- Dry climate (UAE summer): 12-15 °C → high potential
- Tropical (Singapore): 1-3 °C → low potential
Saturation Efficiency
- Target: > 85% for counter-flow
- Cross-flow: 70-80%
Pro Tip: Plot air path on psychrometric chart - if it doesn’t reach 95% RH, you’re losing capacity.
4️⃣ The 7 Key Performance KPIs
| KPI | Formula | Target | Impact if Off |
|---|---|---|---|
| Range | 8-12 °C | Too low → undersized chiller | |
| Approach | 3-5 °C | Too high → poor heat transfer | |
| L/G Ratio | 0.8-1.2 | Too high → flooding | |
| Evaporation Rate | 1-2% | High → makeup cost | |
| Drift Loss | Measured via tracer | < 0.005% | High → environmental fines |
| Merkel Number (KaV/L) | 1.0-2.0 | Low → poor fill performance | |
| Fan Efficiency | > 75% | Low → energy waste |
5️⃣ Root Causes of Low Efficiency: Field Data
| Symptom | Root Cause | Fix Cost | ROI |
|---|---|---|---|
| Approach > 7 °C | Fouled fill (scale/biofilm) | $15K clean | 6 months |
| High ΔP across fill | Clogged nozzles | $2K flush | 1 month |
| Fan current < 80% FLA | Belt slip / VFD fault | $3K repair | 2 months |
| T_cold > T_wb + 6 °C | Low airflow | VFD tuning | 3 months |
| Make-up > 2.5% | Drift eliminator damage | $8K replace | 9 months |
6️⃣ 10 Proven Optimization Strategies
-
Install VFDs + Smart Control
- Vary fan speed depending on approach setpoint
- Saves 30-50% fan power
- Payback: 12-18 months
-
High-Efficiency Fill Upgrade
| Type | KaV/L | Cost | Life |
|---|---|---|---|
| Splash | 0.8 | Low | 5 yrs |
| Film (PVC) | 1.5 | Medium | 10 yrs |
| Trickle (PP) | 2.2 | Low | 15+ yrs |
Case Study: 1000 RT tower → +2 °C range, -15% fan power
-
Automated Chemical Dosing
- ORP + conductivity control
- Prevents scaling & Legionella
- Reduces blowdown by 40%
-
Drift Eliminator Retrofit
- Cellular PVC → < 0.001% drift
- Saves 100 m³/day of water in large towers
-
Infrared Thermography
- Scan fill for hot spots
- Enables predictive cleaning
7️⃣ Digital Twin & Predictive Analytics
Digital Twin of a Cooling Tower
import CoolProp as CP

def tower_efficiency(T_hot, T_cold, T_wb, RH):
    h_in = CP.HAPropsSI('H', 'T', T_hot+273.15, 'P', 101325, 'R', RH/100)
    h_sat = CP.HAPropsSI('H', 'T', T_wb+273.15, 'P', 101325, 'R', 1.0)
    return (T_hot - T_cold) / (T_hot - T_wb) * 100
🔧 Predictive Maintenance
- Vibration sensors detect bearing wear 30 days early
- AI models predict approach creep from weather + load
8️⃣ Tower Type Comparison (2025 Data)
| Type | η_std | Footprint | Maintenance | Best For |
|---|---|---|---|---|
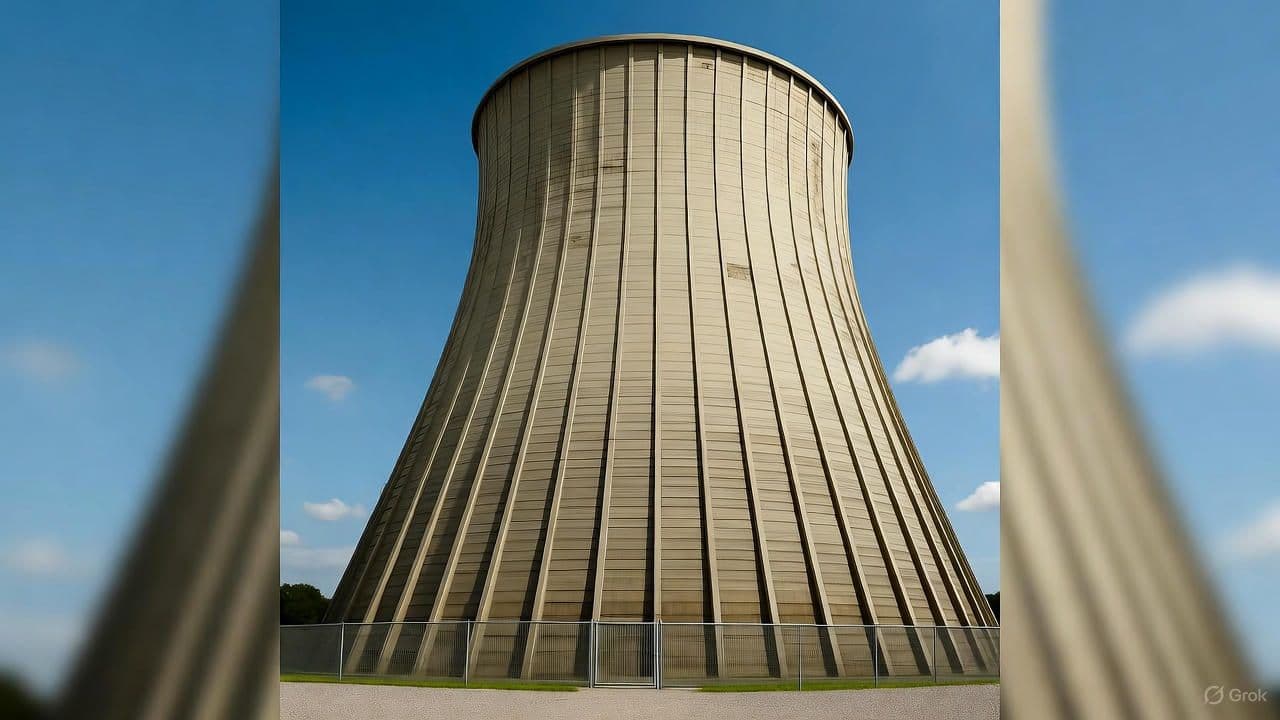
| Natural Draft | 60-65% | Huge | Low | Power plants |
| Counter-Flow Induced | 75-85% | Medium | Medium | Refineries |
| Cross-Flow FRP | 65-75% | Small | High | Rooftop |
| Hybrid (Wet+Dry) | 70-80% | Large | Complex | Water-scarce sites |
9️⃣ Advanced Design: Merkel Number Method
For new tower sizing:
Rule of Thumb:
- KaV/L = 1.0 → standard fill
- KaV/L = 2.0 → high-performance trickle fill
Use Chebyshev integration, or CTI Toolkit for accuracy.
⚡ 10️⃣ Energy-Cost Impact Calculator
| Parameter | Value |
|---|---|
| Tower duty | 200 MW |
| Efficiency gain | +5% |
| Chiller COP | 5.0 |
| Electricity cost | $0.08/kWh |
Annual Savings:
🧰 11️⃣ Maintenance Checklist (Print & Laminate)
- Check fan blade pitch (every 3 months)
- Inspect drift eliminators for gaps
- Measure approach vs design (daily)
- Clean strainers (weekly)
- Test water chemistry (TDS, pH, biocide)
- Verify VFD setpoint logic
- Log makeup & blowdown
📘 12️⃣ References & Standards
- CTI STD-201 - Thermal Performance Certification
- ASHRAE 90.1 - Energy Standard for Cooling Towers
- IAPWS-95 - Water/Steam Properties
- API 661 - Air-Cooled Exchangers (wet bulb design)
- Marley Technical Report (2024) - Fill Performance

