Wet Bulb vs Dry Bulb Temperature | Cooling Tower Guide

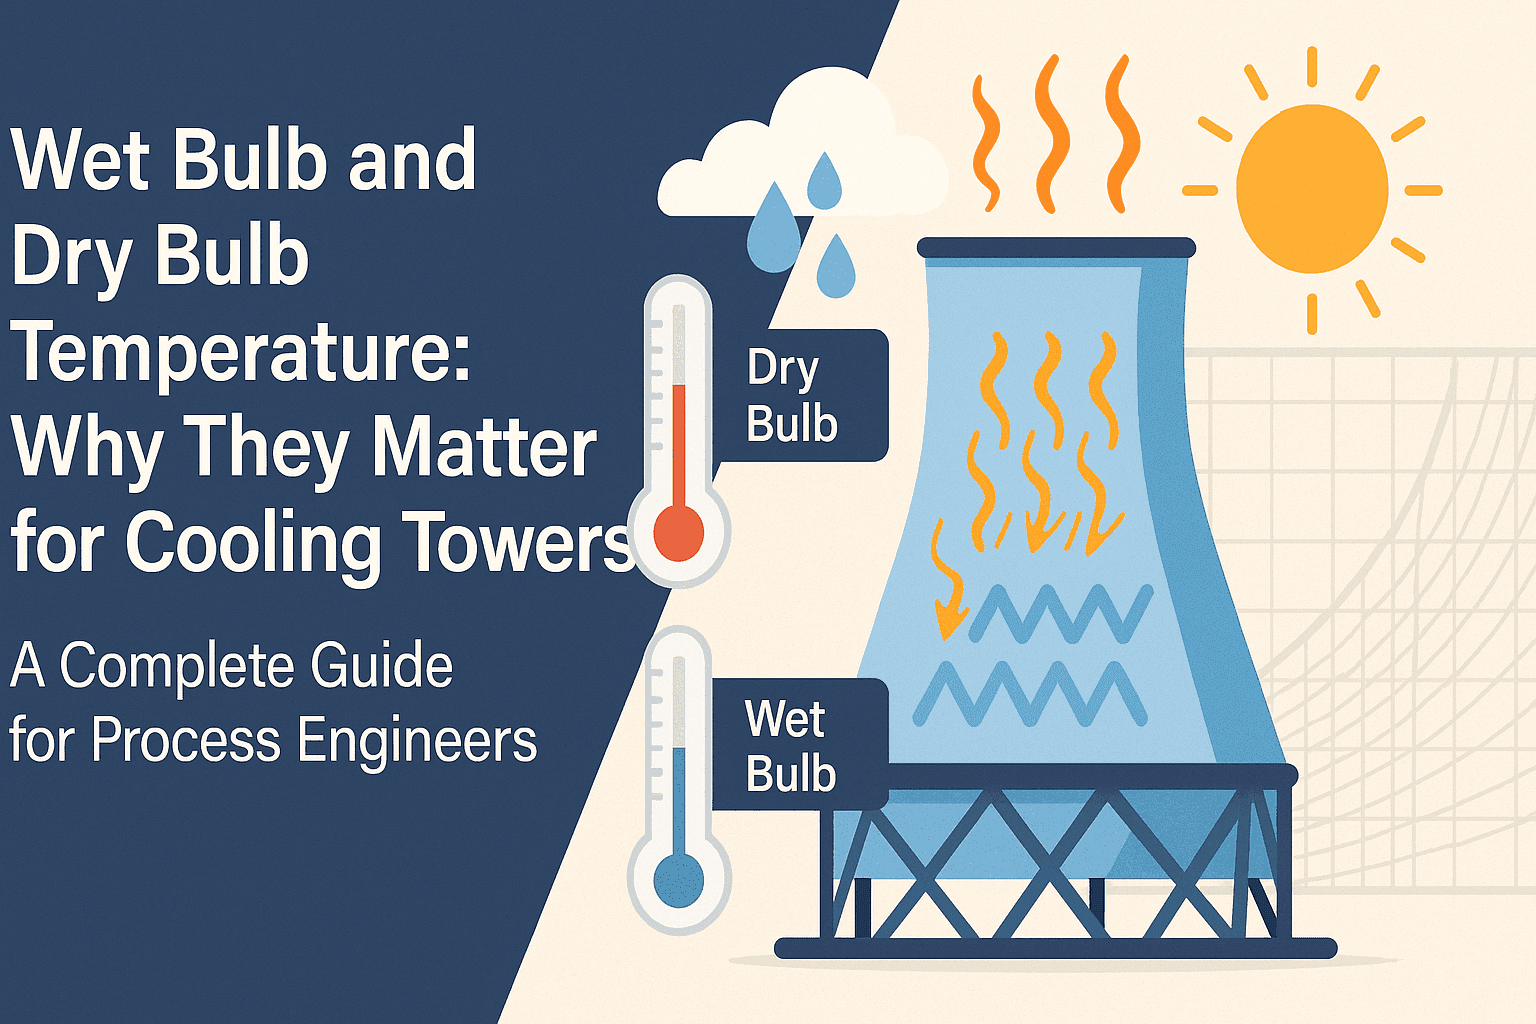
Wet Bulb and Dry Bulb Temperature: Why They Matter for Cooling Towers
A Complete Guide for Process Engineers
Cooling towers are fundamental to chemical plants, refineries, and power stations-yet their engineering rests on a nuanced understanding of how air and water interact, especially through two key meteorological properties: wet bulb temperature (WBT) and dry bulb temperature (DBT).
Mastering these concepts allows process engineers to size equipment, maximize heat rejection, minimize water and energy use, and troubleshoot operational problems.
This article provides a comprehensive resource on what these temperatures mean, how they are measured, their physical basis, and why their difference (and the underlying psychrometric principles) determines cooling tower performance, efficiency, and plant reliability.
What are Dry Bulb and Wet Bulb Temperatures?
Dry Bulb Temperature (DBT)
The dry bulb temperature is what most people call “air temperature”-the actual thermal condition measured by a standard thermometer exposed to air but shielded from direct sun and moisture.
It reflects the sensible heat content of the air:
No water evaporation or humidity is considered-just the true thermal state of atmospheric air.
Wet Bulb Temperature (WBT)
The wet bulb temperature measures the lowest temperature that can be achieved by evaporative cooling.
It is obtained by wrapping the thermometer bulb in a wet cloth (muslin), then exposing it to airflow. As water evaporates from the cloth, it absorbs heat from the bulb, cooling it. The final equilibrium temperature is the wet bulb temperature:
WBT is always equal to or lower than DBT-unless the air is fully saturated (100% relative humidity), at which point they are identical.
Dew Point Temperature
The dew point is the temperature at which air becomes saturated, and moisture condenses.
It’s always lower than DBT and usually lower than WBT-unless the air is fully saturated.
Physical Principles: Why are DBT and WBT Different?
Air can hold varying amounts of water vapor based on its temperature. The evaporation process cools objects (like the wet bulb) because energy is lost from the surface as water vaporizes.
- The dry bulb thermometer records air temperature, unaffected by moisture.
- The wet bulb thermometer cools as water evaporates; the lower the ambient humidity, the greater the temperature drop between DBT and WBT.
- At high humidity, evaporation slows; WBT is closer to DBT.
- At 100% humidity, no evaporation occurs; DBT = WBT = Dew Point.
The difference:
is called the wet bulb depression, and it quantifies the air’s ability to take up more moisture (air dryness).
Measurement Methods: How Are DBT and WBT Determined?
Dry Bulb Measurement
Simple mercury or digital thermometers (shielded from radiant heat and wind) suffice for DBT.
Wet Bulb Measurement
A psychrometer uses two thermometers:
- Dry Bulb: exposed to air.
- Wet Bulb: bulb wrapped in moist wick, air blown over.
After steady airflow (typically several minutes), the wet bulb stabilizes at its lowest achievable temperature.
Modern HVAC sensors often use digital probes with automatic wetting and airflow, but the principle remains the same.
Psychrometric Charts: Relating DBT and WBT to Other Air Properties
Psychrometric charts are the backbone of HVAC and cooling tower engineering. Every state of moist air is characterized by its DBT, WBT, relative humidity (RH), enthalpy, specific volume, and dew point.
| Axis | Property |
|---|---|
| Horizontal | DBT |
| Diagonal/Curved Lines | WBT |
| Curves | Relative Humidity |
| Vertical/Horizontal Projections | Enthalpy, specific volume, dew point |
By locating DBT and WBT on the chart, engineers calculate humidity, enthalpy, and other vital process properties, supporting cooling load calculations and equipment sizing.
Why Wet Bulb and Dry Bulb Temperatures Matter in Cooling Towers
1. Fundamental Role in Heat Rejection
Cooling towers rely on evaporative cooling, rejecting process heat by allowing a small portion of circulated water to evaporate.
The efficiency and minimum achievable water temperature is governed by the ambient air’s WBT, not DBT.
Water can never cool below WBT - this is the theoretical limit.
Example:
On a day with DBT = 35 °C and WBT = 25 °C, a tower cannot cool water below ~25 °C, regardless of size or airflow.
2. Tower Sizing, Approach, and Range
Approach:
Range:
Smaller approach means a larger, more effective tower.
Tower performance is validated by measuring actual DBT, WBT, and water temperatures. This data determines whether the tower meets design specs, especially during hottest conditions.
3. Cycles of Concentration and Water Balance
Evaporation increases concentration of dissolved solids. Engineers use DBT and WBT (as well as flow rates and cycles of concentration) to calculate required blowdown rates and makeup water demand.
4. Cooling Tower Troubleshooting
If a cooling tower fails to achieve its set approach or range:
- Check WBT: Is the ambient wet bulb higher than expected?
- Monitor DBT: Is airflow adequate?
- Psychrometric Chart Analysis: Identify possible causes from enthalpy, RH, or drift.
Engineering Calculations and Formulas
1. Wet Bulb Depression
Greater difference means drier air and greater evaporative cooling potential.
2. Relative Humidity from DBT and WBT
Relative humidity () can be determined from psychrometric equations or charts:
Reference tables or Mollier diagrams provide accurate RH values, which in turn help determine heat rejection capacity.
3. Cooling Potential (Enthalpy Change)
The enthalpy of moist air ():
where:
- = humidity ratio (kg water/kg dry air)
- = latent heat of vaporization
DBT and WBT readings feed into these equations, supporting cooling tower design.
4. Water Temperature Limits
Seasonal and Climatic Implications
| Climate | DBT-WBT Relationship | Cooling Tower Performance |
|---|---|---|
| Hot, Dry | Large difference | Excellent cooling |
| Hot, Humid | Small difference | Reduced cooling |
| Saturated (100% RH) | DBT ≈ WBT | Poor cooling potential |
Engineers must consider local WBT records when sizing or troubleshooting tower installations.
Case Studies and Practical Applications
Example 1: Cooling Tower Sizing
Plant: circulating water, 40 °C in, 30 °C out; local DBT = 35 °C, WBT = 27 °C.
A tower with 3 °C approach is high-performance; tower must be sized to achieve it even at peak WBT.
Example 2: Tower Performance Troubleshooting
Issue: Summer stats show tower cold water at only 33 °C (intake 40 °C) when expected cold water is 29 °C.
Analysis:
Local WBT measured at 31 °C (higher than usual).
Conclusion: Tower working as designed; elevated WBT due to rare humid spell.
Advanced Topics: Psychrometric Analysis in Cooling Tower Optimization
- Use real-time DBT/WBT measurement for automated fan and flow control.
- Model heat rejection using Mollier diagrams or simulation software (Aspen Plus, MATLAB).
- Integrate local meteorological data for predictive maintenance and seasonal optimization.
Health, Safety, and Environmental Impact
- High WBTs stress cooling towers, leading to inadequate process cooling and risk of process upset.
- Legionella control: High humidity promotes microbial growth; precise DBT/WBT monitoring enables proactive management.
- Water Consumption: Efficient design lowers drift and total makeup demand. DBT/WBT pairs help forecast losses.
Key Takeaways for Engineers
- Wet Bulb Temperature (WBT) defines the limit of cooling tower performance; water cannot cool below it.
- Dry Bulb Temperature (DBT) alone is insufficient for tower design or troubleshooting.
- The Wet Bulb Depression () quantifies cooling potential.
- Psychrometric charts are essential tools linking DBT, WBT, RH, and enthalpy.
- Routine measurement of DBT and WBT ensures optimal process control.
- Always design for peak WBT, not just average DBT.
Summary Table: Wet Bulb vs. Dry Bulb and Cooling Tower Relevance
| Parameter | Explanation | Cooling Tower Impact |
|---|---|---|
| Dry Bulb (DBT) | Standard air temperature | Used for ambient conditions |
| Wet Bulb (WBT) | Lowest temp via evaporation | Defines cooling limit |
| Wet Bulb Depression () | High depression = better cooling | |
| Relative Humidity | Moisture content of air | Affects evaporation rate |
| Dew Point | Temp of full saturation | Impacts condensate management |
| Approach | Design specification | |
| Range | Heat removed from process |
Conclusion
Wet bulb and dry bulb temperatures, though simple to measure, are fundamentally complex and critically important in cooling tower operation, selection, and process integration.
Understanding their difference, physical meaning, and role in heat rejection science enables engineers to build, operate, and maintain reliable and efficient cooling systems across all climates.
Always reference local WBT data, use psychrometric charts, and measure both DBT and WBT regularly - it’s the hallmark of sustainable, well-engineered thermal systems.
References
- NOAA / Weather.gov - Dry Bulb & Wet Bulb Definitions
- ClimateCheck - Wet-Bulb vs Dry-Bulb Engineering
- The Engineering Toolbox - Psychrometric Properties
- ASHRAE Fundamentals Handbook
- Perry’s Chemical Engineers’ Handbook
- ScienceDirect - Wet-Bulb Temperature
- PMF IAS and Drishti IAS - Meteorological Principles

